How to Identify and Focus on Tobacco Content User Groups That Truly Contribute Profit
I once witnessed a very typical scenario.
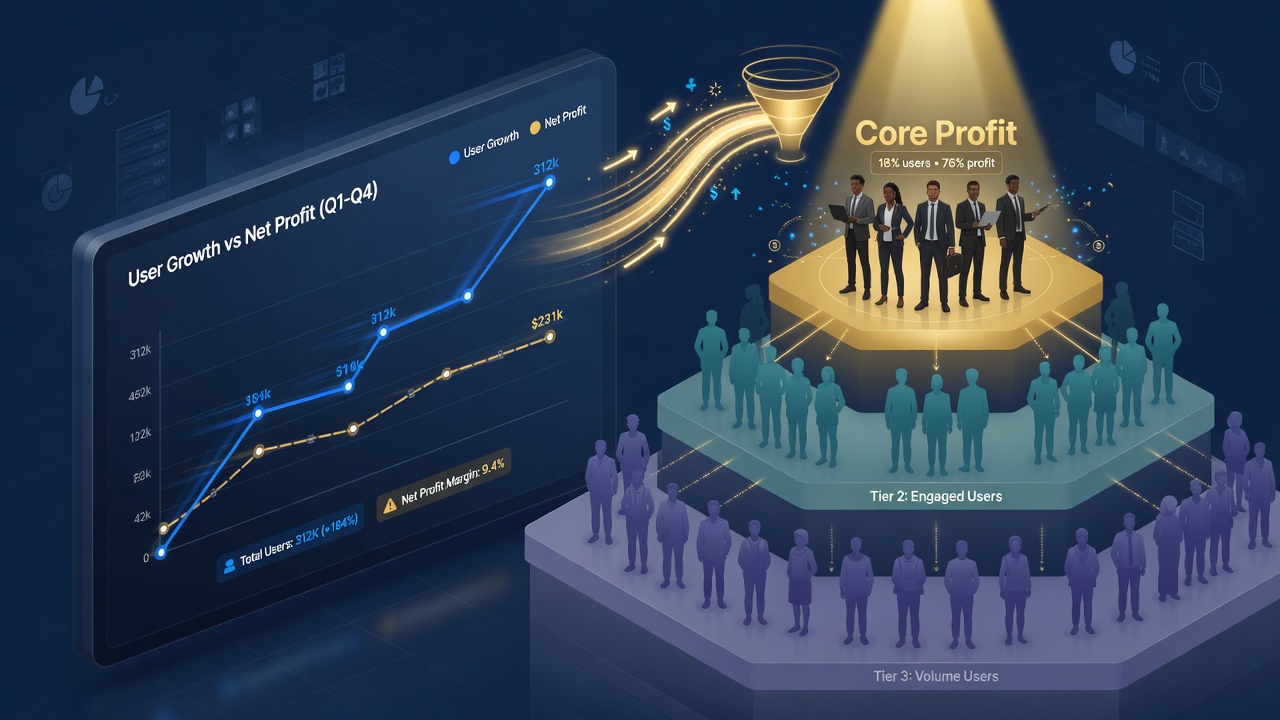
In the spring of 2025, a platform operations team working on tobacco industry content grew their monthly active users from over 80,000 to over 120,000. During the operations department meeting, the data looked impressive: UV increased by more than 50%, article readership went up, account followers grew, and comments and bookmarks also increased.
But when the finance department presented another spreadsheet, the meeting room suddenly fell silent.
Revenue had increased by only about 7%, while content production costs rose nearly 30%, user incentive costs went up by 30%, and the workload for customer service and operations personnel had also increased significantly. In the end, the new revenue brought by user growth did not even fully cover the new costs.
This incident struck me deeply.
User growth and profit growth are fundamentally not the same thing.
Many content teams stare at DAU, readership numbers, follower counts, and dwell time every day. I think these metrics are not wrong, but they can at most tell you "whether users came or not."
People who truly manage profit must continue to ask one more question:
How much money did these users actually leave us?
I. When I judge whether a user is worth investing in, the first thing I look at is not follower count
In the past, when doing user operations, it was easy to form a habit:
The more active a user is, the higher their value.
Someone who opens the app every day is more important than someone who opens it twice a week; someone who reads 20 articles is more important than someone who reads two; someone who comments a lot is more important than someone who doesn't.
This logic is only half correct.
If a user reads 20 articles every day but has no stable return visits and no effective commercial behavior, and the platform has to invest red packets, points, activities, and massive content production costs every day just to maintain their activity, then their "activity" may actually be a cost.
Conversely, a user who only opens the app two or three times a week but each time precisely consumes core industry content, persists for more than three months, and has a stable response to high-value content — this user may not be active, but could be very valuable.
So now when I look at users, I usually break the problem into four layers:
First layer, look at behavior.
Do they come or not?
Second layer, look at quality.
Are they a real, stable person with sustained behavior?
Third layer, look at commercial value.
Has their behavior generated actual commercial contribution?
Fourth layer, look at cost.
How much did we actually spend to acquire and serve this user?
Only when the first three layers are good and the fourth layer is controllable will I define this user as someone truly worth operating.
This essentially pushes traditional "user profiling" one step forward toward "user profit profiling."
II. Traditional user profiling answers "who they are," profit profiling answers "how much they are worth"
Traditional user profiling is very easy to do.
Age:
30–40 years old.
Region:
A certain province, a certain city.
Occupation:
Retail terminals, industry practitioners, enterprise personnel.
Interests:
Industry news, product information, business management.
These labels are certainly useful, but if I were a profit manager, I wouldn't stop here.
I care more about another table.
| User Dimension | What I Really Want to Know |
|---|---|
| Activity | How many times have they come in the last 30 days? |
| Content | What do they actually read? |
| Depth | Do they read thoroughly or just skim? |
| Retention | Are they still here after 30 days? |
| Response | What content can prompt them to take action? |
| Commerce | Have they generated effective commercial contributions? |
| Acquisition | How much did it cost to bring them in? |
| Service | How much content and labor do they consume each month? |
| Lifecycle | Can they last half a year, a year, or even longer? |
| Net Contribution | How much profit is ultimately left? |
The biggest difference between these two types of profiling is right here:
User profiling describes users; profit profiling determines resource allocation.
Harvard Business School's research on customer lifetime value inherently links customers' future value with marketing resource allocation: not all customers should receive the same investment; instead, we should seek customer groups that can bring higher long-term value.
I strongly agree with this approach.
Because the scarcest things for a content team are never just money.
There are also editorial time, topic selection capability, operations personnel, activity resources, homepage placement, and customer communication time.
If these resources are spread evenly across all users, they will inevitably be wasted.
III. For tobacco content users, I prefer to divide them into five layers based on "profit contribution"
When I actually do user analysis, I don't like to simply divide users into "high, medium, and low."
Because the concept of "medium" is too vague.
Instead, I divide users into five layers:
Layer A: Core Profit Users
These users typically have several obvious characteristics:
Stable behavior, long retention time, clear core content consumption, and relatively clear commercial value.
They don't necessarily visit every day.
But every time they visit, it's relatively "purposeful."
For example, rather than aimlessly scrolling through 20 articles from the homepage, they actively search for certain types of industry policies, business methods, corporate updates, or professional content.
This type of user has a very clear content consumption path.
I give the best content resources to them first.
Not because they are the most numerous, but because their per-user contribution is the highest.
Layer B: High-Potential Users
These users haven't yet reached Layer A, but their behavior has already started to change.
For example:
Visited 8 times in the past 30 days;
Only 3 times in the previous 30 days.
Or they used to only browse general news but have recently started reading in-depth content consistently.
I take this type of user very seriously.
Because they represent "rising value."
If you only sort by current revenue, it's easy to overlook them.
Therefore, user screening cannot rely solely on static rankings — it must also look at trends.
Layer C: Ordinary Active Users
This group is usually the largest in number.
They may read content every day, and may occasionally comment or bookmark.
But they show no clear commercial or long-term value.
I won't give up on them.
But I also won't invest too many expensive resources in them.
Basic content service is sufficient.
Layer D: Low-Value Users
Typical performance:
Active, but low value.
For example, they participate in activities every day, collect points, and browse content, but their actual contribution is very small.
This type of user is the most likely to create an operational illusion.
The backend data looks very lively.
But the financial data doesn't change.
For Layer D users, I prefer to reduce the frequency of high-cost operations rather than continuously using incentives to keep them "artificially active."
Layer E: Abnormal or High-Cost Users
This category includes:
Abnormal traffic, obvious bot behavior, one-time campaign traffic, and people who require high operational costs over the long term but contribute almost no value.
The most important action for this group is not "continue operating them."
It is:
Stop unnecessary resource investment.
Reduce manual service, cut high-cost incentives, and move them to a low-cost content pool.
User operations is not charity.
If a user consistently consumes more resources than the value they can generate, you should recalculate how to manage them.
IV. One thing I oppose most: Copying RFM without adaptation
RFM is a very valuable customer analysis method.
R stands for recency, F for frequency, and M for monetary value. Many CRM systems now use RFM as the basis for customer segmentation. Salesforce's definition of RFM also revolves around grouping by recent purchase time, purchase frequency, and cumulative spending.
But tobacco content operations cannot simply copy it mechanically.
Because the "monetary value" of a content platform may not come directly from user purchases.
So I redefine M.
I interpret it as:
The effective value a user can generate within the entire content commercial system.
This value can come from:
Effective commercial response;
High-value content consumption;
Effective leads;
Long-term retention;
Content dissemination;
Enterprise client value;
Commercial project contribution.
Therefore, I prefer to call it:
Content Value RFM.
R looks at whether the user has had a key behavior recently.
F looks at whether this behavior is stable.
M looks at how much effective value this user can actually contribute.
This way, RFM is no longer just a report from the data department, but becomes a resource allocation tool that operations teams can use directly.
V. What really needs to be calculated is not user revenue, but user net contribution
I think this is the most common mistake many content teams make.
A user generates 100 yuan in commercial revenue, and the operations person says:
"This user is worth 100 yuan."
This is completely wrong.
Consider a user:
Commercial contribution: 100 yuan;
Acquisition cost: 25 yuan;
Content service cost: 10 yuan;
Operations cost: 8 yuan;
Incentive cost: 5 yuan.
What's actually left:
52 yuan.
If another user generates 70 yuan in revenue:
Acquisition cost: 10 yuan;
Content service cost: 25 yuan;
Operations cost: 20 yuan;
Incentive cost: 10 yuan.
Only 5 yuan left.
The second user's "revenue" looks decent, but there is almost no profit.
So now when I look at users, I at least establish this simple model:
User Net Contribution = Commercial Contribution − Acquisition Cost − Content Cost − Operations Cost − Incentive Cost
This is not meant to make operations people calculate users with a calculator every day.
It is meant to change the team's way of thinking.
From:
"This user is very active."
To:
"How much is this user worth us spending?"
These are two completely different questions.
VI. I once saw a very typical "Active User Trap"
In April 2025, a content project ran a campaign with its front-line operations team.
The campaign lasted 28 days.
Before the campaign, the platform had about 84,000 monthly active users.
After the campaign ended, monthly active users reached 119,000.
A 41.7% increase.
The operations lead was very excited.
But I asked the data team to pull three more reports.
The first:
New user 30-day retention.
The second:
User incentive costs.
The third:
Effective commercial contribution generated by new users.
When the results came out, the problem was very obvious.
Among the 35,000 new users, a significant portion came in intensively during the campaign period.
After the campaign ended, visit frequency dropped rapidly.
At the same time, user incentive costs increased from about 40,000 yuan per month to 55,000 yuan.
To meet the demand of the new traffic, the content team temporarily added a large amount of low-barrier content.
Editors' daily production increased from about 35 articles to nearly 50 articles.
Content costs also rose.
The most awkward part:
The platform gained more users, but did not obtain a proportional increase in profit.
After this incident, my judgment about "user growth" changed.
When someone later tells me:
"This campaign added 30,000 new users."
My first question won't be:
"That many?"
It will be:
"How many of them will still be worth serving 90 days from now?"
VII. Real user screening should start from 90-day data, not from one day of data
If I were to take over a tobacco content project today, I wouldn't start with user profiling on the first day.
I would first pull the data from the last 90 days.
The reason is simple:
One day of data can only show behavior.
30 days of data can show activity.
90 days of data begins to show stability.
The specific operation can be broken into ten steps.
Step 1: Pull 90-day user data
At least include:
User ID, first visit time, most recent visit time, visit count, content read count, core content read count, interaction count, commercial content response, source channel, incentive records, etc.
Step 2: Clean abnormal users
Separate bot traffic, abnormal behavior, duplicate accounts, and one-time campaign accounts.
Don't let abnormal traffic pollute your user profiling.
Step 3: Redefine "effective activity"
I won't simply define activity as "opened once."
You must establish your own effective activity standard.
For example:
Visit + core content consumption + effective dwell time.
Step 4: Build behavior tags for users
For example:
Policy-oriented user;
Business-oriented user;
Industry news-oriented user;
Deep content-oriented user;
Activity-oriented user.
Step 5: Calculate RFM
But use the content operation's own RFM.
Step 6: Add costs
This is a step many user analysis projects miss.
For users from each channel, estimate the approximate acquisition cost.
For different types of users, also estimate content and operations costs.
Step 7: Form a user profit matrix
At this point, you will see a very interesting result:
Some users are large in number but contribute very little profit.
Some users are few in number but contribute a significant portion of commercial value.
Step 8: Re-segment into A/B/C/D/E layers
After segmentation, don't just stick labels on them.
Each layer must correspond to a resource strategy.
Step 9: Observe for 30 days
Don't adjust today and declare success tomorrow.
Observe at least one full cycle.
Step 10: Recalculate
User tiers are not permanent.
An A user may drop to B.
A B user may rise to A.
A D user may also enter B through content adjustments.
Therefore, user tiering should be a dynamic system, not a permanent label on an Excel spreadsheet.
VIII. Those most worth investing in are often not the ones making the most money today, but those "whose profit is rising"
This is a point I insist on.
If you only look at past revenue, it's easy to form a mistake:
Whoever contributed the most in the past gets the most resources forever.
In reality, user value changes.
I focus on two things:
Current value.
And:
Rate of value change.
For example:
User A contributed 1,000 yuan in the past 90 days, but now only 50 yuan per month.
User B contributed 400 yuan in the past 90 days, but in the last three months it was 80 yuan, 150 yuan, and 220 yuan respectively.
If you only look at cumulative amount, User A is clearly higher.
But if you look at the trend, User B may be more worth investing in.
So I add a column to the user profit table:
Value growth rate.
This metric often reveals things that traditional user profiling cannot discover.
IX. There is another type of user that is very easily misjudged: active but not profitable
For example, a user:
Visits 7–8 times a day;
Reads a dozen articles a day;
Comments a lot;
High activity participation rate;
Opens almost every operational push.
Looks like a "super user."
But upon further analysis:
No clear preference for high-value content;
Very low response to commercial content;
Much of their activity comes from campaigns and rewards;
Requires frequent maintenance by operations staff;
Long-term retention is not particularly outstanding.
So is this user valuable or not?
My answer is:
Not necessarily.
They are a "high-activity user," but not necessarily a "high-value user."
These two labels must be separated.
If you mix them together, the operations team will constantly pursue:
More opens;
More clicks;
More comments;
More activity participation.
In the end, the whole team is busy.
Only profit doesn't grow in sync.
X. Content resources should tilt toward "high-value user problems"
The ultimate goal of user segmentation is not to create a pretty user profile.
It is to change content production.
For example, Layer A users care most about in-depth industry content, so the content team should increase the supply of this type of content.
Layer B users are migrating from general news to in-depth content, so you can design content upgrade paths for them.
Layer C users mainly consume basic news, so maintaining a stable supply is sufficient.
For Layer D users, if they mainly rely on low-cost content, don't keep increasing labor costs just to boost readership by a few percentage points.
In this way, user segmentation ultimately influences topic selection.
I believe this is the stage where user operations truly begins to enter the realm of business management:
It's not "we produce whatever users consume," but "we know which users are worth operating, so we decide what content to produce for them."
XI. Which users should receive reduced investment?
Many teams are reluctant to talk about this.
Because operations departments naturally love growth.
But profit management must accept a fact:
Some users simply should not continue to be operated at high cost.
For example:
Long-term dependence on rewards to stay active;
Acquisition cost clearly exceeds lifetime value;
Rapid churn after campaign ends;
High consumption of manual service;
High content consumption but no effective value generated;
Obvious abnormal behavior;
Only appears during short-term campaigns.
My approach is usually not to delete them directly.
But to adjust the resource level.
From high-cost operations:
To ordinary content reach.
From manual service:
To automated service.
From high-value incentives:
To low-cost content operations.
From active acquisition:
To natural growth.
The purpose is not to "drive users away."
It is:
Don't continue operating low-value users with high-cost methods.
This is also a core idea in customer profitability management: low-profit customers are not necessarily worthless, but they should be regrouped based on profitability and development potential, rather than using the same resource strategy for all customers.
XII. I believe the most important table a content team should build is not a user growth table, but a user profit table
If I had to choose the most important business report, I would choose:
| User Layer | Users | 30-Day Retention | Commercial Contribution | Acquisition Cost | Operations Cost | Content Cost | Net Contribution |
|---|---|---|---|---|---|---|---|
| A Core | 8,500 | 82% | 1.85M | 210K | 160K | 240K | 1.24M |
| B Potential | 15,000 | 67% | 1.42M | 250K | 210K | 310K | 650K |
| C Ordinary | 48,000 | 39% | 950K | 300K | 350K | 540K | -240K |
| D Low Value | 31,000 | 18% | 290K | 270K | 310K | 390K | -680K |
| E Abnormal | 6,500 | — | 30K | 90K | 70K | 60K | -190K |
The most important thing about this table is not the numbers themselves.
It is that it forces management to ask three questions:
First, why are there so many Layer C users, yet they are losing money?
Second, why do Layer A users account for only a minority but contribute the vast majority of profit?
Third, where should our next budget actually be invested?
Once management starts asking these three questions, user operations transforms from a traffic department into a profit department.
XIII. If the annual content budget is only 1 million yuan, I won't divide it evenly
Suppose a content project has only 1 million yuan per year available for content, operations, and user growth.
The simplest approach:
Divide 1 million yuan equally among all users.
I think this is one of the least efficient methods.
A more reasonable approach should be:
First, calculate historical net contribution by user tier;
Then, calculate the future value of different user groups;
Finally, determine resource allocation.
Layer A users may deserve more in-depth content.
Layer B users should receive more growth-oriented content.
Layer C users maintain basic content supply.
Layer D users reduce high-cost operations.
Layer E users focus primarily on resolving anomalies and cost issues.
This is consistent with the basic idea of customer lifetime value: limited marketing budgets should be prioritized for customer groups with higher expected value, rather than simply allocated evenly.
I even believe:
The core of budget allocation is not "which user group has the most people," but "which user group can generate more additional profit for every additional 1 yuan invested."
This is the true profit perspective.
XIV. The 5 mistakes I most commonly see
Mistake 1: Treating follower count as user value
Having many followers only proves you have more followers.
It doesn't prove those followers are worth investing in.
Mistake 2: Treating DAU as the ultimate goal
DAU is a process metric.
It is not a profit metric.
If DAU grows by 30% but costs grow by 50%, this growth may even be negative.
Mistake 3: Only looking at revenue, ignoring costs
A user bringing in 100 yuan in revenue and a user bringing in 80 yuan cannot be directly compared to determine which is more valuable.
You must factor in acquisition, content, operations, and incentive costs.
Mistake 4: Not changing resources after user segmentation
This is the most common "formalism."
You create an A/B/C/D table, but everyone still receives the same content, same activities, and same operations.
Such segmentation has no business value.
Real segmentation must change:
Content, frequency, personnel, incentives, and budget.
Mistake 5: Only looking at the past, not the future
User value is dynamic.
People who were profitable in the past may be churning.
People who were ordinary in the past may be growing rapidly.
Therefore, user segmentation must include trend indicators.
XV. I increasingly believe: truly excellent content operations is not about serving all users well
This statement may not align with traditional user operations habits.
But from a profit management perspective, I believe it is correct.
A content team cannot produce content infinitely.
An operations team cannot serve users infinitely.
And budgets certainly cannot increase infinitely.
So the real question is never:
"Can we serve all users well?"
It is:
"Which users are worth us investing our best resources in?"
This is the question that user profiling should truly answer.
A user's age, region, occupation, and interests are certainly important.
But for a business manager, the four most important numbers are:
How much value can they bring?
How much have we spent on them?
Is their value rising or falling?
How much is still worth investing in the future?
If you can't answer these four questions, the so-called user profiling is probably still at the market analysis level.
If you can answer them, then user profiling truly enters the business management level.
Conclusion: Don't operate all users; operate user relationships with profit potential
I increasingly don't believe the saying "the more users, the better the business."
For content businesses, the number of users is just an entry point.
What truly determines business quality is user structure.
80,000 high-value users and 200,000 low-value users may represent two completely different businesses.
1 million page views and 1 million in profit are also completely different things.
So now when I do user analysis, I always return to a very simple question:
How much should we still spend on this user?
If the answer is that it's worth it, and the future value is still growing, continue adding resources.
If the answer is uncertain, reduce investment and continue observing.
If the answer is long-term loss, don't maintain so-called "activity" with high-cost methods.
This is not giving up on users.
This is putting limited content, personnel, and budget where they can truly generate long-term value.
The end goal of content operations is never to have the most users, but to form a group of user relationships that can continuously contribute profit and are worth operating long-term.